Difference between revisions of "File:Taxes region.png"
Jump to navigation
Jump to search
| Line 1: | Line 1: | ||
| − | + | This graph shows the flow of taxes in the [[Experimental Tax System]] for a normal region. | |
Latest revision as of 14:16, 2 November 2006
This graph shows the flow of taxes in the Experimental Tax System for a normal region.
File history
Click on a date/time to view the file as it appeared at that time.
| Date/Time | Thumbnail | Dimensions | User | Comment | |
|---|---|---|---|---|---|
| current | 14:16, 2 November 2006 | 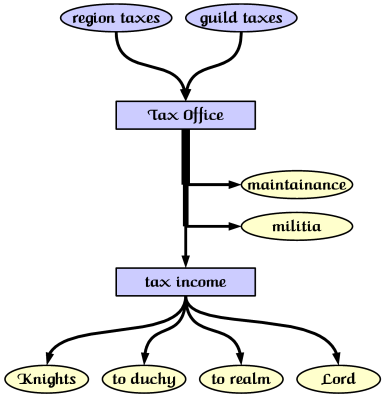 | 387 × 400 (44 KB) | Tom (talk | contribs) |
- You cannot overwrite this file.
File usage
The following page uses this file: